While understanding the importance of the macro backdrop, which has been challenging in China, our firm continues to believe in the fundamentals of the Chinese financial services industry.
Here we take the opportunity to provide a foundational overview of the financial services industry in China. Our financials sector Portfolio Manager, Paul Sloane, goes through some of the most pressing questions on investors' minds today
Lets take a quick look at the a snapshot of the typical Chinese individual and household. How does it compare relative to other countries in EM and globally?
Income growth in China has been the strongest of the major emerging market economies. Since 2011 the GDP per capita has increased by over 80%1 . Today, the average Chinese person has an income level of 11,000 USD per annum1.
GDP per capita: China and emerging markets
| China | India | Indonesia | Korea | Philippines | Thailand | Vietnam | |
|---|---|---|---|---|---|---|---|
| 2021 | $11,188 | $1,937 | $3,893 | $32,731 | $3,328 | $6,124 | $3,409 |
| 2011 | $6,153 | $1,285 | $2,826 | $26,187 | $2,465 | $5,092 | $2,136 |
| % change | 82% | 51% | 38% | 25% | 35% | 20% | 60% |
Household borrowings (leverage) for the Chinese individual is still at a manageable level when benchmarked as a % of GDP.
Below we can see the level of indebtedness benchmarked against other key global economies.
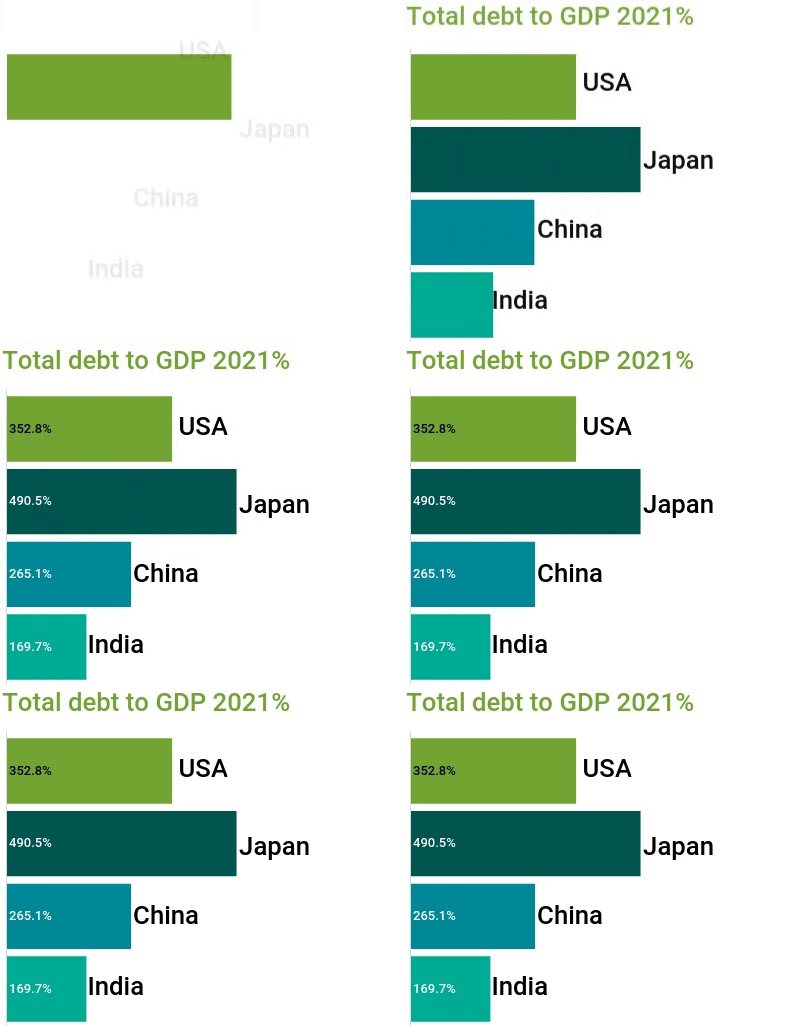

Source: IMF Global Debt Database as at 31 December 2021
China is the largest contributor of the global middle class. Currently over 40% of the world’s middle class population is in China.
Paul Sloane, Portfolio Manager
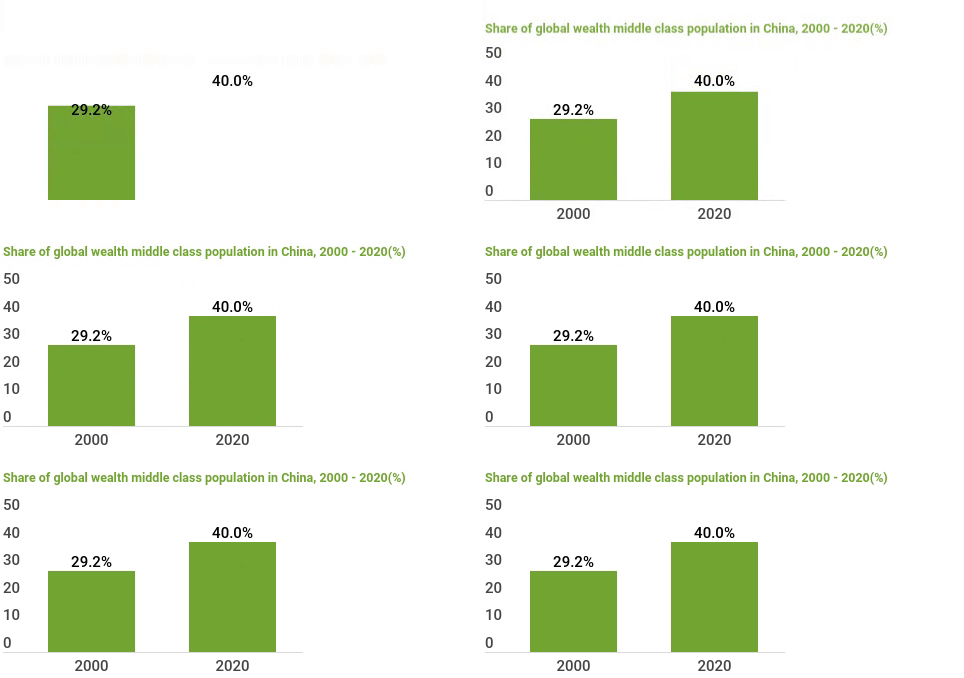
Source: Statista as at 31 December 2020.
How do we think about the middle class opportunity set in China?
China is the largest contributor of the global middle class. Currently over 40% of the world’s middle class population is in China2 . Looking out to 2030, nearly all of the growth in the global middle class will come from the Asian region with pronounced leadership from China itself3 .
We’ve received additional color on the middle class opportunity from AIA which has a significant footprint in China through high-end insurance products. According to AIA, they expect their addressable market – i.e. the Chinese middle class/affluent – to go from 120 million people to over 627 million by 20303.
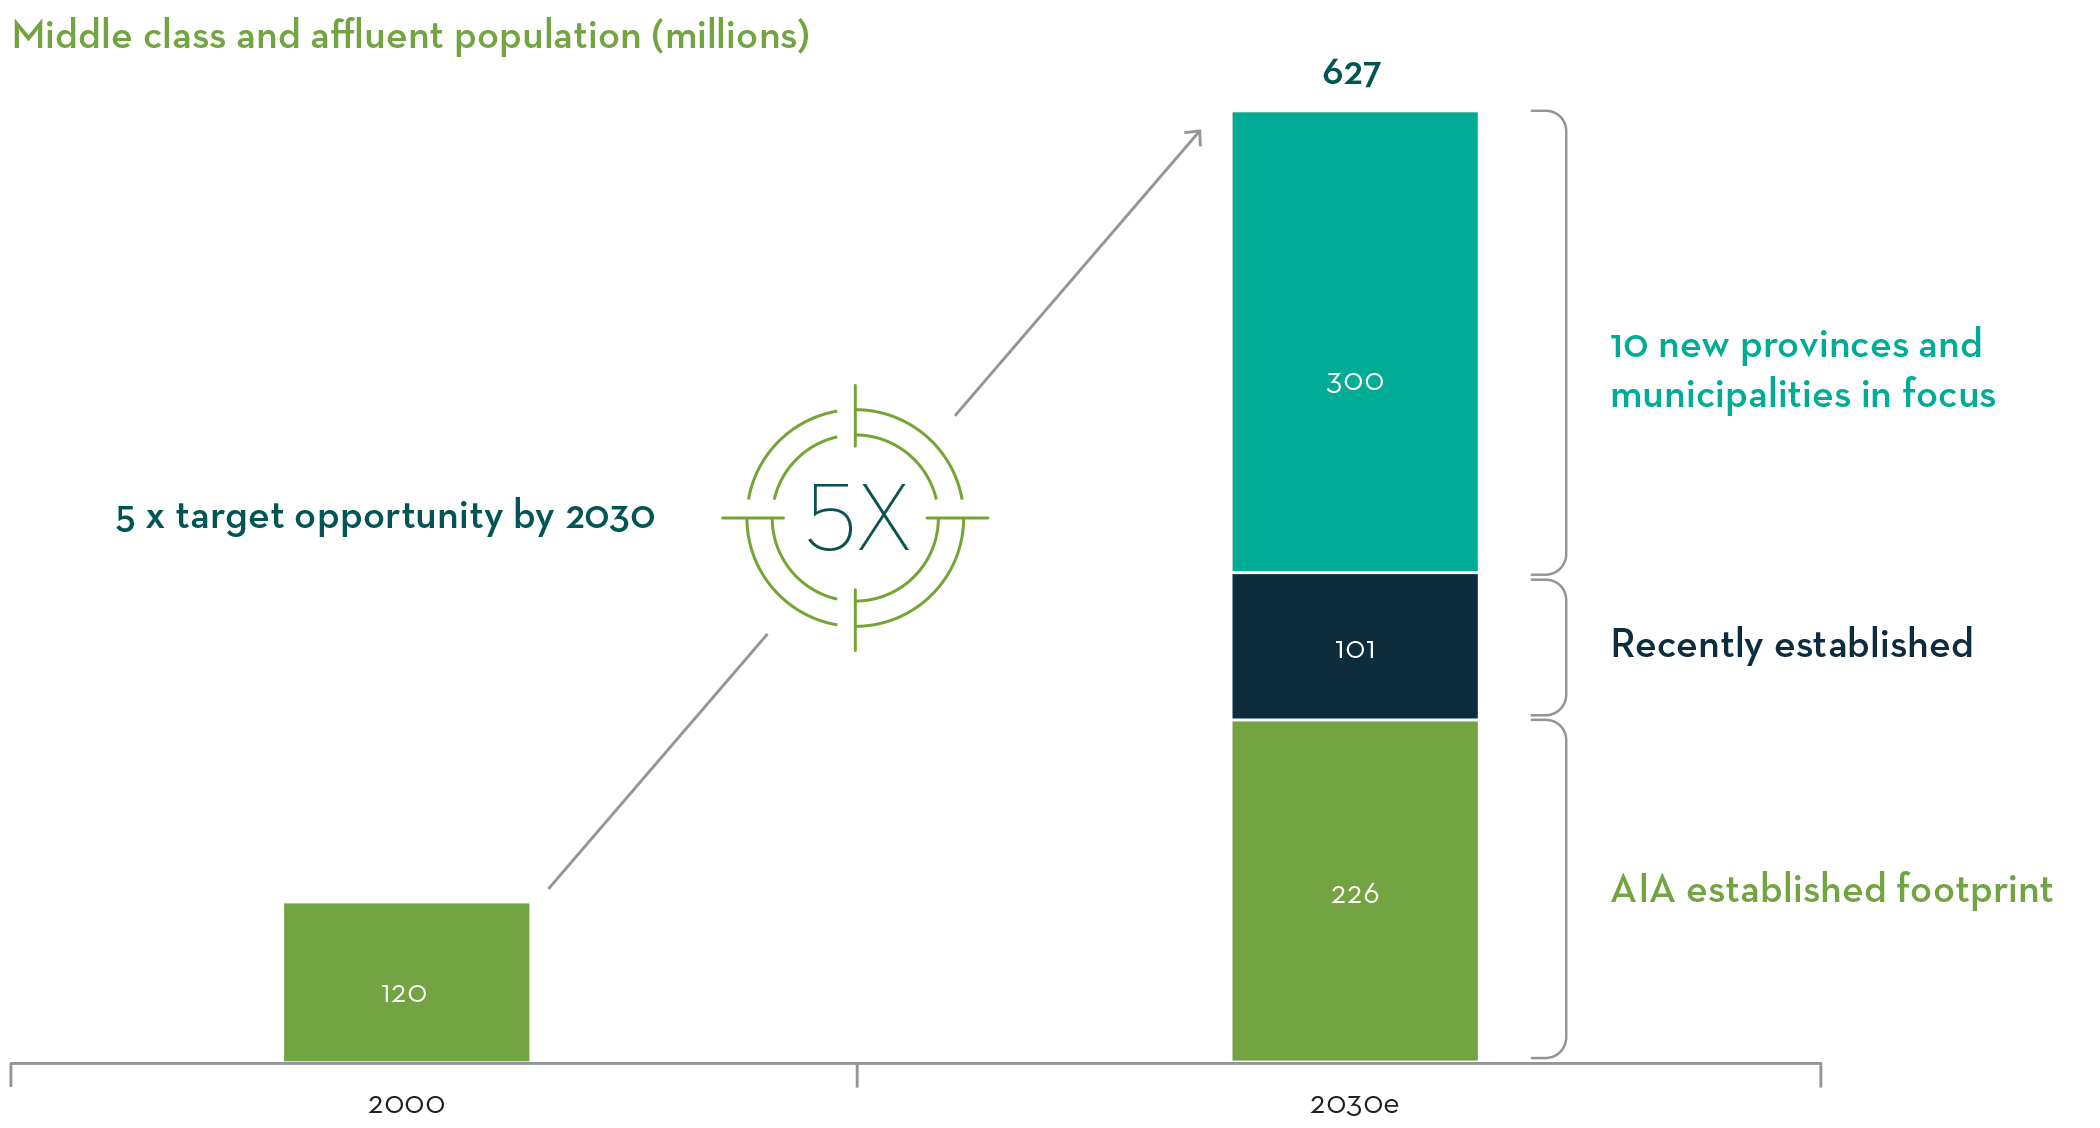
Source: AIA Group FY22 Investor Presentation.
Should we be concerned about inflation in China? What is the level of inflation in China, and how is it different from the experience in the US?
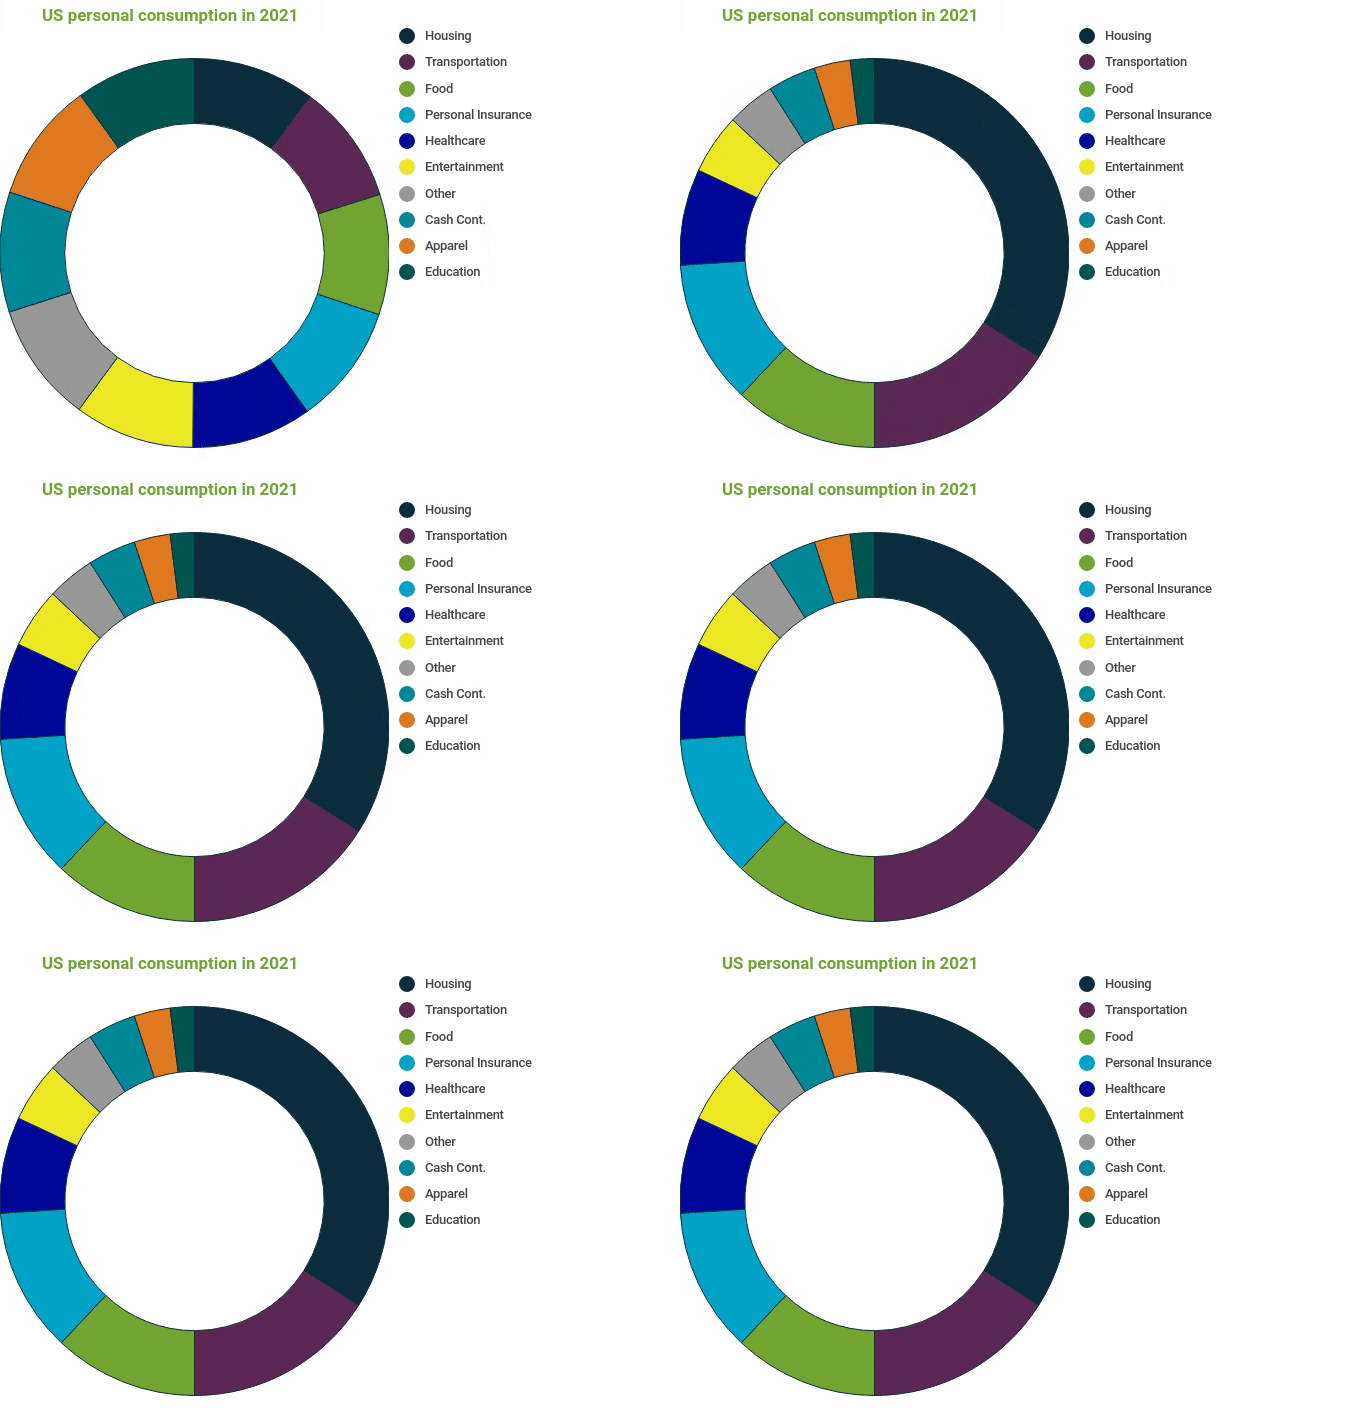
Source: Bureau of Labor Statistics, Consumer Expenditure Surveys, September 2022.
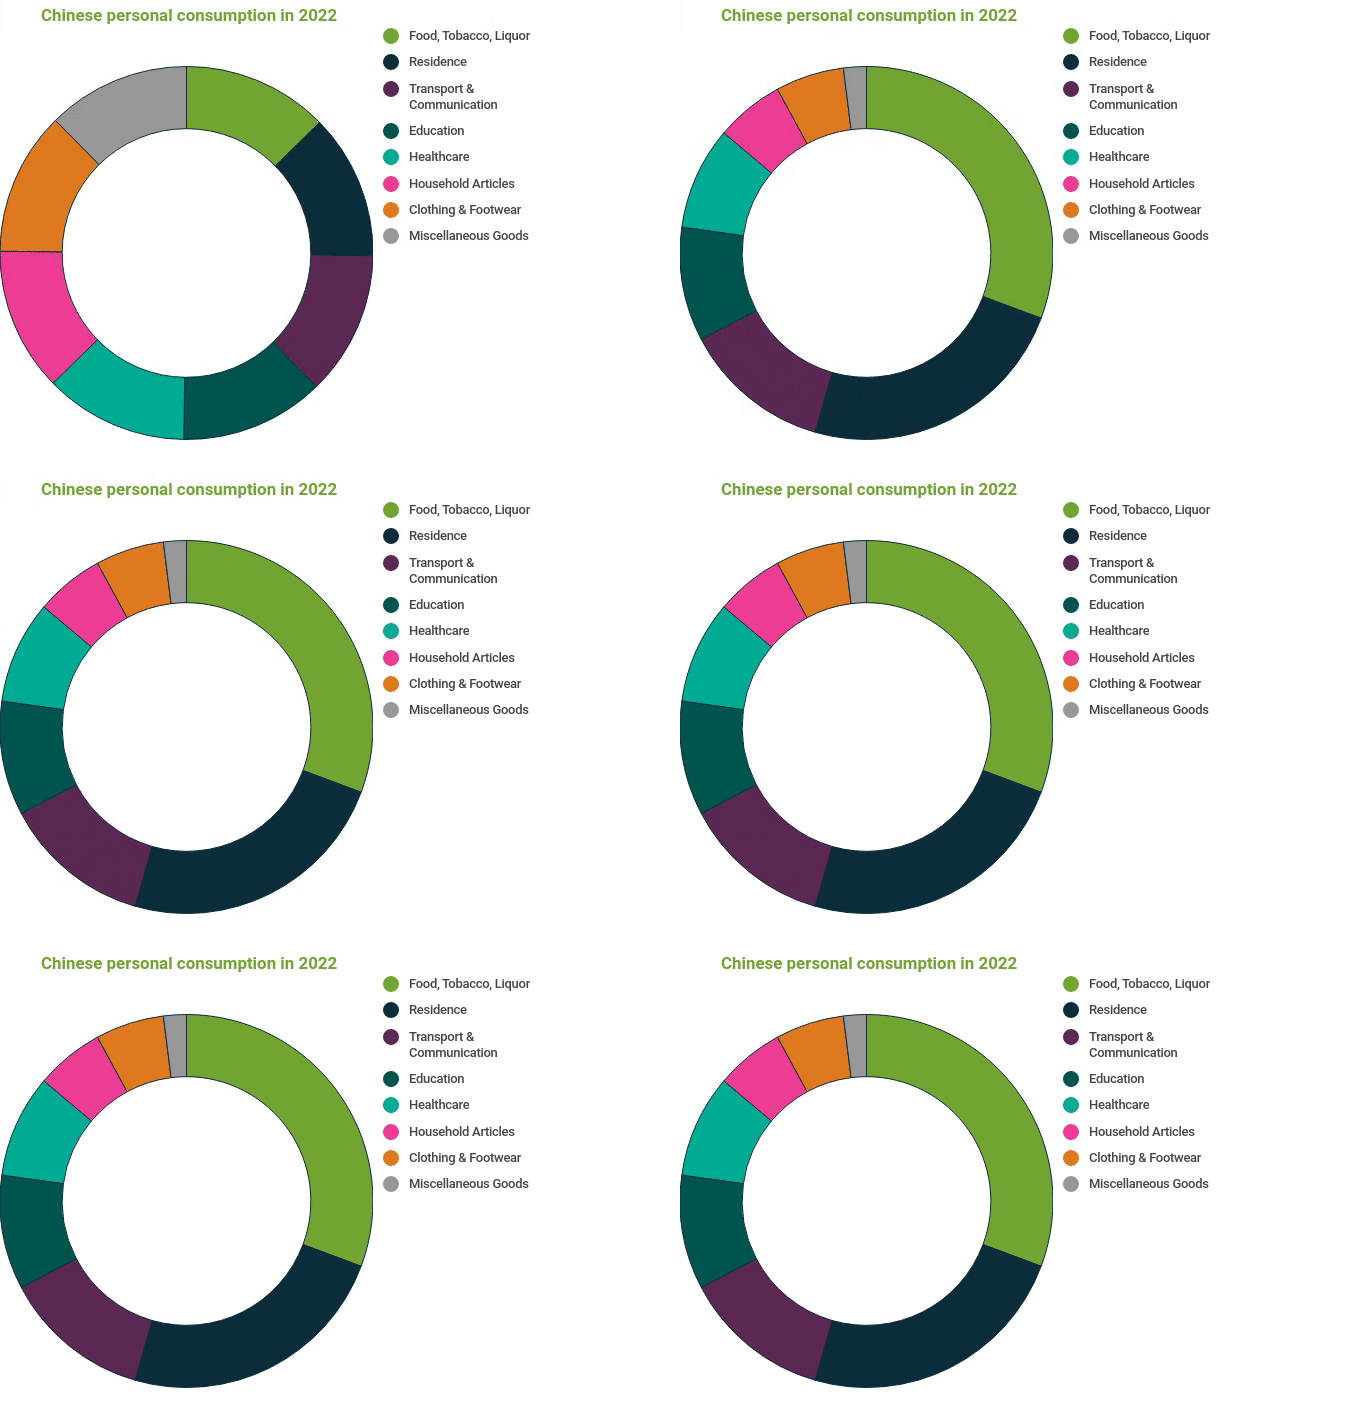
Source: National Bureau of Statistics, China 2022 as at 18 January 2023.
Consumption expenditure in China is dominated by food with nearly 31% of expenses driven by it4. The recent Chinese inflation experience is benign with some indicators showing deflation (producer price index). Investors often ask us how China’s inflation is different from the US experience:
- First, we are not seeing asset inflation in China as a result of higher rents or property prices.
- Second, wage inflation is not a problem relative to the US (where there has been a fall-off in labor force participation over the last few years).
- Finally, the consumption basket in China is geared more to goods than services.
Can we give a broad overview of financial assets in China? What makes asset allocation different in China vs a market like the US?
The fire power of the Chinese household is evident in their cash and deposits allocation. Standing at nearly 14.3 trillion USD5 it is nearly the same level of liquid assets held in the US (16.4 trillion USD)6 . In China, deposits are nearly 50% of financial assets – in the US this number is 16%5 .
We believe that there are several secular asset allocation trends we will see in China. First, a move into equity assets (away from property investment and high risk debt securities) and second, an ever present need to build a financial safety net through life insurance. We’ve highlighted in orange and green below where we think the seismic shifts in allocation will happen in China.
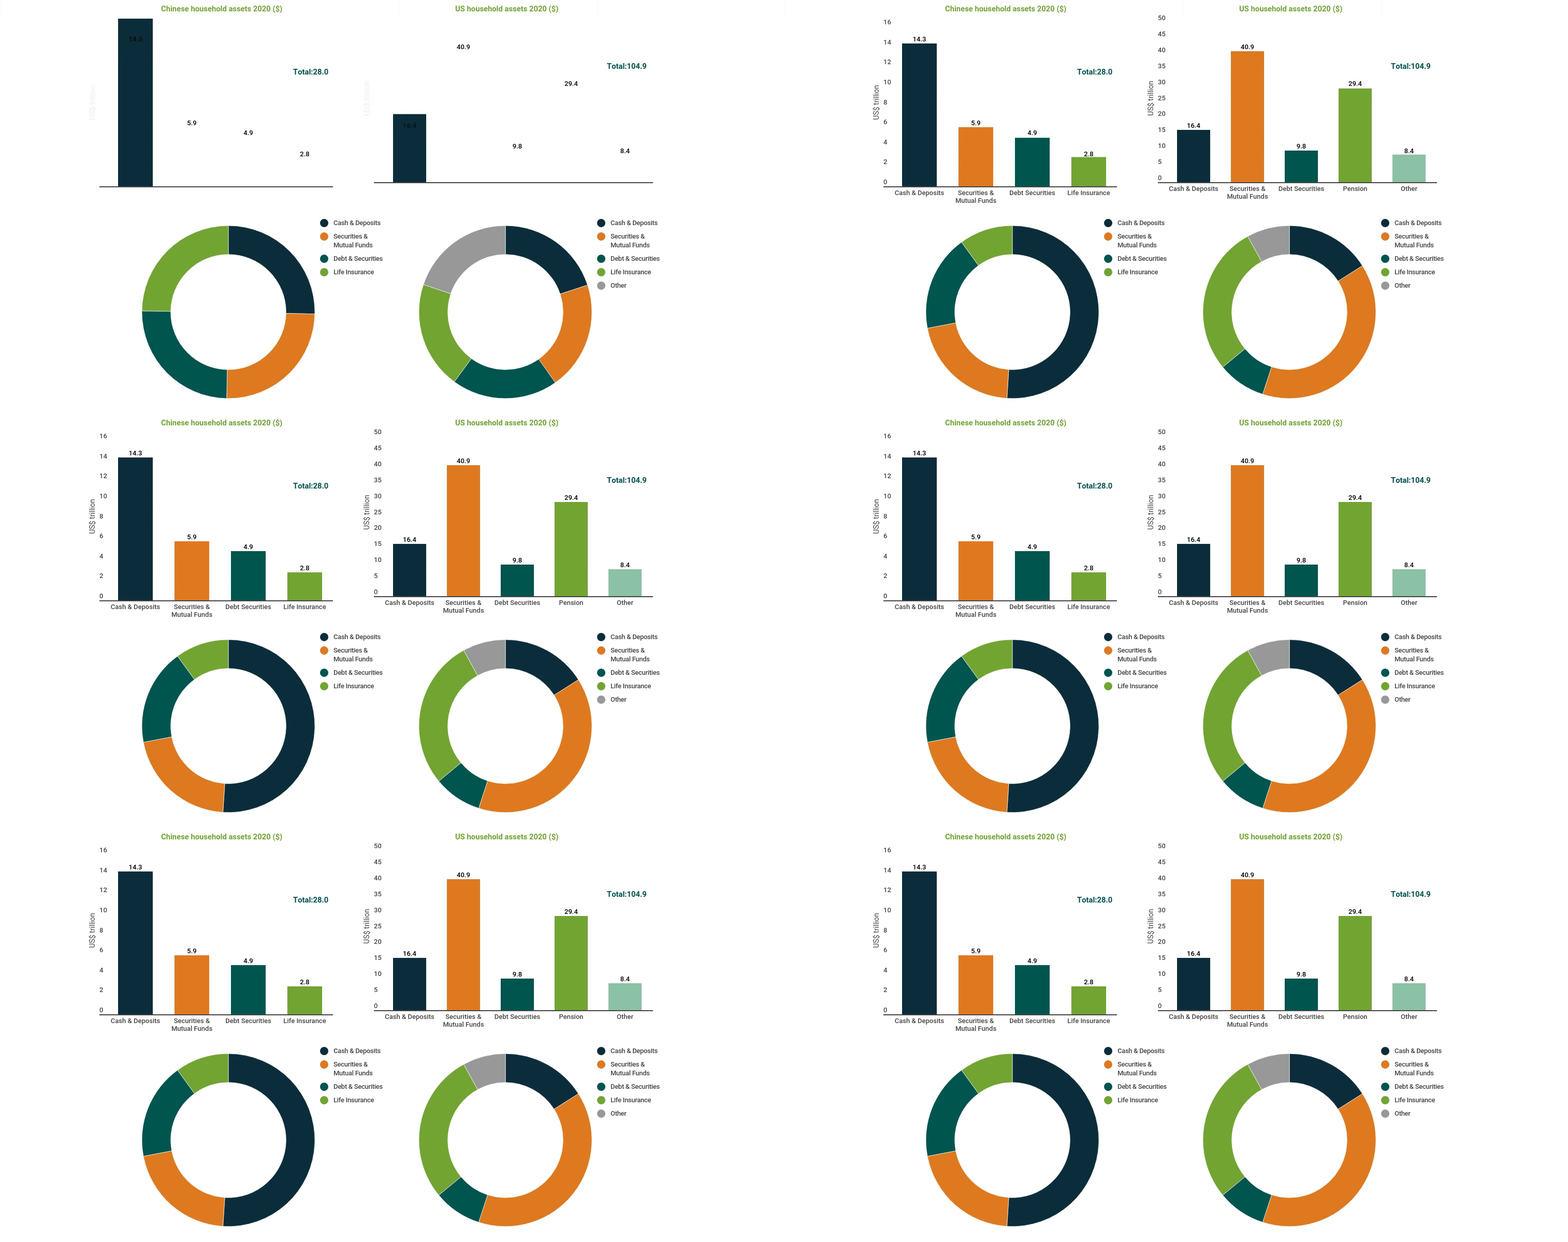
Another interesting observation about Chinese household assets is the very strong growth in deposits during the Covid period. Chinese households have saved more and consumed less and their deposit growth has been driven by income growth rather than subsidies from governments in the form of unemployment/pandemic payments. The average savings rate in China is 30% with savings rates in areas like Beijing/Shanghai approaching 40%7 .
Clearly the Chinese Property Market is under pressure. How do we think about the impact to the economy and the potential risks to the financial system?
We’ve spent some time looking at the financial assets of China – the property market is by far the single largest asset within total household assets. Estimates range but property assets are nearly 40% of an average Chinese person’s assets and mortgage loans are also nearly the 40% of total individual borrowings7 . Household debt levels are similar to levels seen in other large economies and are further supported by the largest deposit base in China
Mortgages in China are characterized by three key attributes: 1) They are fully recourse 2) The downpayment ratios are significant with average loan to value of ~70% 3) They fully amoritize over a 30 year period and are “plain vanilla” in structure.
Can we talk about the impact of demographic change? What names will benefit from the ageing of China?

China is one of the few global economies where there are limited public pension/retirement benefits and limited health insurance coverage. The lack of social safety net is idiosyncratic to China (especially relative to the US and Europe). Insurance products will play a key role as China ages.
These three changes will happen nearly simultaneously over the next 10 years. First, China is defined by a significant protection gap. This means that government health care supports less than 60% of system healthcare7. This protection gap is more severe especially compared to geographies like the US and Europe.
Second, China’s population is undergoing a demographic shift with a rapidly ageing population. Ageing demographics will increase demand not just for healthcare/life insurance but also for pensions and annuities. China’s Social Security System covers only 50% of the pension needs for the country7.
This means that private pensions and annuity market has a significant role to play in funding the pension gap.
Finally, income growth will drive increased demand for insurance. We’ve seen this same growth engine in other Asian markets like HK/Singapore/Taiwan where we’ve seen insurance growth go hand in hand with income growth. When individuals have more disposable income growth, they are able to invest in assets that have elements of both duration and protection.
Ageing demographics will increase demand not just for healthcare/life insurance but also for pensions and annuities.
Paul Sloane, Portfolio Manager
The wealth management industry is one highest growth opportunities in China. What is the growth outlook for wealth management. Who are the key players in the space. How is the business model the same/different when we compare to global wealth managers?
When we look at the asset managers in China they are already at a globally competitive scale. The country’s largest asset manager, China Merchants Bank has roughly 500 million USD in AUM8 . Its assets would put its business within the top 10 of wealth managers globally.
The second largest private player in the wealth management business in China is Ping An Bank. Most of the larger players in the space are part of the National Banking System (BOC, ICBC, CCB, ABC).

Source: Statista, Leading Wealth Managers, 2020.

Source: Statista, Leading Private Banks in China, 2021.
Why do Chinese financials matter? What percentage of MSCI China is financials and what percentage of EM is China financials? How is Martin Currie’s exposure to Chinese Financials positioned differently?
Financials is the third largest sector in MSCI China9.
It is 16% of MSCI China and 5% of MSCI EM9 . Most of this exposure is bank stocks. We are relatively overweight Chinese financials but have a very different quality exposure10.
- We have no State Owned Enterprise (SOE) bank exposure. These are the banks that are owned by the government of China. They are nearly 73% of the MSCI China Banks11.
- We do own a national commercial bank (China Merchants) but the company is distinguished by its best in class management team and operations. It has one of the largest fee income franchises in China. They are less exposed to pure lending businesses.
- Ping An Bank and Ping An Insurance are the leading private enterprise companies in the financial space and have one of the highest sector ROEs.
- AIA is part of our HK exposure and not our China exposure, per se. AIA has a growing and vibrant China business however its core operations are in HK/Singapore/SE Asia.
Portfolio exposure to Chinese financials
| Absolute (%) | Index (%) | Relative (%) | |
|---|---|---|---|
| China Merchants | 2.1 | 0.3 | 1.7 |
| Ping An Bank | 1.2 | 0.0 | 1.1 |
| Ping An Insurance | 2.4 | 0.7 | 1.7 |
| Chinese financials | 5.6 | 5.1 | 0.5 |
| Chinese banks | 3.2 | 3.1 | 0.1 |
| China | 28.9 | 32.1 | -3.2 |
Source: Martin Currie as at 28 February 2023. Data presented is for the Martin Currie Global Emerging Markets representative account. MSCI Emerging Markets Index used as benchmark.
Click to display all sources >>
The information provided should not be considered a recommendation to purchase or sell any particular strategy/fund/ security. It should not be assumed that any of the securities discussed here were or will prove to be profitable. It is not known whether the stocks mentioned will feature in any future portfolios managed by Martin Currie. Any stock examples will represent a small part of a portfolio and are used purely to demonstrate our investment style.
1Source: Bloomberg as at 31 December 2021.
2Source: Statista as at 31 December 2020.
3Source: AIA Group FY22 Investor Presentation.
4Source: National Bureau of Statistics, China 2022 as at 18 January 2023.
5Source: Morgan Stanley research report "Where China's Wealth Will Go" published 22 September 2021.
6Source: Federal Reserve Bank Financial Accounts Data as at 31 December 2020.
7Source: CLSA research report "The Great Shift Part I" published 8 September 2022 and "The Great Shift Part II" published 3 January 2023.
8Source: FactSet and China Merchants Bank company data as at June 2022.
9Source: FactSet as at 28 February 2023.
10Source: Martin Currie as at 28 February 2023.
11Source: FactSet and Martin Currie as at 28 February 2023.
Regulatory information and risk warnings
This information is issued and approved by Martin Currie Investment Management Limited (‘MCIM’), authorised and regulated by the Financial Conduct Authority. It does not constitute investment advice. Market and currency movements may cause the capital value of shares, and the income from them, to fall as well as rise and you may get back less than you invested.
The information contained in this document has been compiled with considerable care to ensure its accuracy. However, no representation or warranty, express or implied, is made to its accuracy or completeness. Martin Currie has procured any research or analysis contained in this document for its own use. It is provided to you only incidentally and any opinions expressed are subject to change without notice.
The document does not form the basis of, nor should it be relied upon in connection with, any subsequent contract or agreement. It does not constitute, and may not be used for the purpose of, an offer or invitation to subscribe for or otherwise acquire shares in any of the products mentioned.
Past performance is not a guide to future returns.
The distribution of specific products is restricted in certain jurisdictions, investors should be aware of these restrictions before requesting further specific information.
For institutional investors in the USA:
The information contained within this presentation is for Institutional Investors only who meet the definition of Accredited Investor as defined in Rule 501 of the United States Securities Act of 1933, as amended (‘The 1933 Act’) and the definition of Qualified Purchasers as defined in section 2 (a) (51) (A) of the United States Investment Company Act of 1940, as amended (‘the 1940 Act’). It is not for intended for use by members of the general public.
For institutional investors in Canada:
The content of this website is suitable for Permitted Clients for the purposes of NI 31-103 only. The information on this section of the website is not intended for use by any other person, including members of the public.
Click to display all sources >>
The information provided should not be considered a recommendation to purchase or sell any particular strategy/fund/ security. It should not be assumed that any of the securities discussed here were or will prove to be profitable. It is not known whether the stocks mentioned will feature in any future portfolios managed by Martin Currie. Any stock examples will represent a small part of a portfolio and are used purely to demonstrate our investment style.
1Source: Bloomberg as at 31 December 2021.
2Source: Statista as at 31 December 2020.
3Source: AIA Group FY22 Investor Presentation.
4Source: National Bureau of Statistics, China 2022 as at 18 January 2023.
5Source: Morgan Stanley research report "Where China's Wealth Will Go" published 22 September 2021.
6Source: Federal Reserve Bank Financial Accounts Data as at 31 December 2020.
7Source: CLSA research report "The Great Shift Part I" published 8 September 2022 and "The Great Shift Part II" published 3 January 2023.
8Source: FactSet and China Merchants Bank company data as at June 2022.
9Source: FactSet as at 28 February 2023.
10Source: Martin Currie as at 28 February 2023.
11Source: FactSet and Martin Currie as at 28 February 2023.
Regulatory information and risk warnings
This information is issued and approved by Martin Currie Investment Management Limited (‘MCIM’), authorised and regulated by the Financial Conduct Authority. It does not constitute investment advice. Market and currency movements may cause the capital value of shares, and the income from them, to fall as well as rise and you may get back less than you invested.
The information contained in this document has been compiled with considerable care to ensure its accuracy. However, no representation or warranty, express or implied, is made to its accuracy or completeness. Martin Currie has procured any research or analysis contained in this document for its own use. It is provided to you only incidentally and any opinions expressed are subject to change without notice.
The document does not form the basis of, nor should it be relied upon in connection with, any subsequent contract or agreement. It does not constitute, and may not be used for the purpose of, an offer or invitation to subscribe for or otherwise acquire shares in any of the products mentioned.
Past performance is not a guide to future returns.
The distribution of specific products is restricted in certain jurisdictions, investors should be aware of these restrictions before requesting further specific information.
For wholesale investors in Australia:
This material is provided on the basis that you are a wholesale client within the definition of ASIC Class Order 03/1099. MCIM is authorised and regulated by the FCA under UK laws, which differ from Australian laws.


