


The Martin Currie Asia Pacific Urban Trends Income (APUTI) strategy invests in a unique blend of listed Real Asset securities – such as REITs, infrastructure and utilities – from both developed and emerging Asia Pacific ex Japan countries.
The strategy is specifically focused on listed Asia Pacific ex Japan Real Assets due to their unique leverage to the multi-decade megatrend opportunity of urban population growth, which ultimately facilitates stronger income and capital growth
Alongside the Asia Pacific ex Japan region’s attractive urban population growth megatrend, we believe there are several key reasons for income investors to consider a blend of Asia Pacific ex Japan listed Real Assets, both now, and for the long-term.
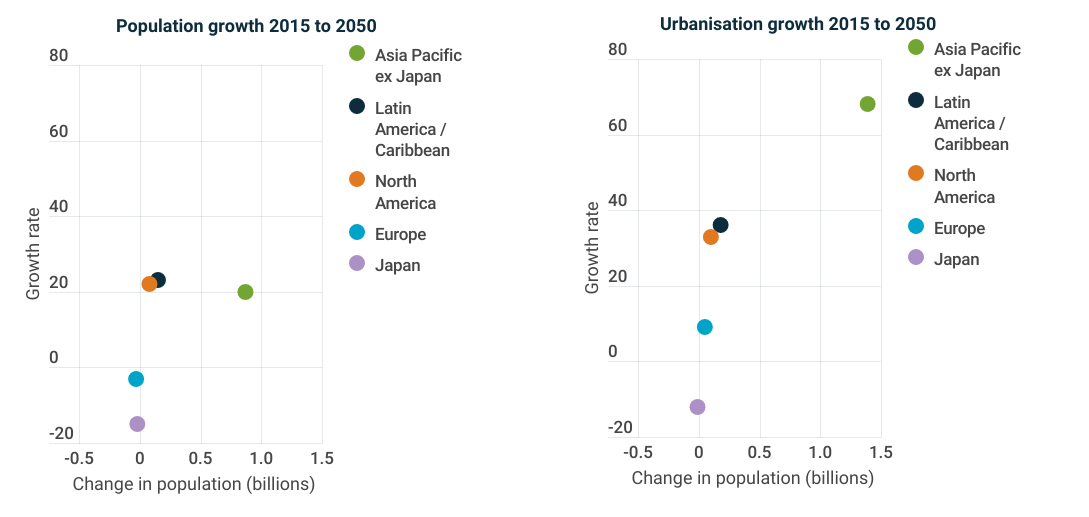
The Asia Pacific region’s higher urban population growth
Overall, the global population is growing, but some countries and cities are going backwards. Global growth is being particularly superpowered by Asia Pacific ex Japan urbanisation trends. The region’s total population is forecast to grow by >20% or almost 1 billion people from 2015 to 20501, and urbanisation is expected to further boost growth in certain cities.
Listed Asia Pacific ex Japan Real Assets have unique leverage to the multi-decade megatrend opportunity of urban population growth
We are also seeing migration towards the region ramp-up post Covid, which is boosting the region’s population growth outlook. This is particularly strong for Australia and New Zealand. In fact, Australia's population growth is projected to be greater than India's up to 2050, and ranks first amongst all developed markets globally.
This rapid urban population growth will translate into significant demand growth for Real Asset services for across the Asia Pacific ex Japan region over the coming decades. These population and urbanisation megatrends are enduring and are expected to hold well into the future.
The Asia Pacific ex Japan region is also seeing stronger real GDP growth forecasts relative to Europe and the US, which provides a further tailwind for population growth2.
Upside from ongoing Covid-19 reopening in Asia Pacific region
Asia Pacific ex Japan Real Assets are well positioned to deliver dividend growth due to the easing of regional Covid restrictions, particularly in Hong Kong and China, driving a cash flow recovery.
The reopening thematic is particularly strong for Asia Pacific Real Asset sectors such as retail REITs and transport infrastructure as people begin to travel and shop again. On the other hand, this tailwind is no longer blowing for Europe and the US as they have already returned to normal.
The higher yield of Asia Pacific Real Assets
The APUTI strategy's consensus forward income yield continues to offer a premium to the income yield of the reference benchmark, the broader market and other asset classes3.
Our focus on high-quality income stocks keeps the strategy away from speculative names and high multiple/low yielding stocks that have larger weights in broader market indices.
Attractive valuation of Asia Pacific Real Assets
Listed Asia Pacific Real Assets are continuing to trade at more attractive valuations than unlisted Real Assets and other broader market equities, and many are still trading below their pre-Covid levels4.
For example, our key REIT holdings within the APUTI strategy are trading at a noticeable discount to their net tangible assets. While in the utility space, we continue to see unlisted investors pursuing listed utilities via M&A offers at significant premiums to listed prices.
We believe investors can therefore improve their yield and returns by switching from unlisted Real Assets into listed Real Assets.
Beneficiary of rising inflation and interest rates
The near-to-medium term path for inflation and interest rates continues to trend up. Our APUTI holdings typically have inflation protection mechanisms and strong pricing power, that should result in meaningful cashflow growth as inflation rises.
While infrastructure and utilities stocks will typically fare better with accelerating inflation than REITs, we note that some REIT segments, such as Retail, can also provide solid inflation protection, highlighting the importance of blending Real Assets sectors and being selective through proprietary research.
Low volatility and correlations in an uncertain world
Listed Real Assets also typically show lower absolute risk than broader equities, and lower correlation to other asset classes, making Asia Pacific Real Assets an interesting tactical play in the current inflationary world, especially with economic uncertainty on the rise and heightened geopolitical tensions and supply chain pressures.
The APUTI strategy's resilience during recent periods of market weakness has not only been a standout in Asia but also on a global scale against global equities, infrastructure, and property indices5.
Exposure to key structural themes
The strategy is also positioned to benefit structurally from other medium- to long-term thematics such as
- Technology change fuelling opportunities for data and network providers
- Healthcare and lifestyle assets for ageing populations
- Increased capital deployment into renewable energy generation and electrification
- Build of critical infrastructure for sustainable communities
These themes will help drive attractive long-term income and growth for Real Assets that service them.
Click here to find out more about how the Martin Currie Asia Pacific Urban Trends Income (APUTI) strategy has been specifically designed for investors looking for a high, stable and growing income stream, with lower volatility than the broader equity market.
Click to display all sources >>
Past performance is not guide to future returns. The investment vehicles shown may have different risk profiles and a direct comparison may not be appropriate.
1 Source: Martin Currie Australia, UN Population Division; latest available as of 31 December 2022. United Nations, Department of Economic and Social Affairs, Population Division (2018). World Urbanization Prospects: The 2018 Revision; online edition.
2 Source: Martin Currie Australia, Bloomberg, as of 31 December 2022
3 Source: Martin Currie Australia, FactSet; as of 31 December 2022. Data calculated for the representative Martin Currie Asia Pacific Urban Trends Income account. This strategy is not constrained by a benchmark; however, yields are also compared against the MSCI AC Asia Pacific ex Japan Index, MSCI AC World Index, S&P 500, US 10yr bonds and the Barclays Global Aggregate Index. The Expected next 12 Months (NTM) Income is calculated using the weighted average of broker consensus forecasts of each strategy holding – because of this, the returns quoted are estimated figures and are therefore not guaranteed and may differ materially from the figures mentioned. The figures may also be affected by inaccurate assumptions or by known or unknown risks and uncertainties. In respect of the broker consensus data the number of brokers included for each individual stock will depending on active coverage of that stock by a broker at any point in time. A median of brokers is typically utilised. All estimates avoid stale forecasts which are removed after a certain number of days.
The composite index is comprised of 50% MSCI AC Asia Pacific ex Japan REITS (Net Dividends) Index and 50% MSCI AC Asia Pacific ex Japan Utilities (Net Dividends) Index is used for performance comparison purposes. The strategy is constructed in a benchmark-unaware manner.
4 Source: Martin Currie Australia, FactSet, as of 31 December 2022.
5 Source: Martin Currie Australia, as of 31 December 2022. Data shown for a representative Asia Pacific Urban Trends Income strategy, in US$ gross of fees, without deducting investment advisory fees, broker commissions, or other expenses that reduce the return to investors.
Important information
This information is issued and approved by Martin Currie Investment Management Limited (‘MCIM’), authorised and regulated by the Financial Conduct Authority. It does not constitute investment advice. Market and currency movements may cause the capital value of shares, and the income from them, to fall as well as rise and you may get back less than you invested.
The information contained in this document has been compiled with considerable care to ensure its accuracy. However, no representation or warranty, express or implied, is made to its accuracy or completeness. Martin Currie has procured any research or analysis contained in this document for its own use. It is provided to you only incidentally and any opinions expressed are subject to change without notice.
The document does not form the basis of, nor should it be relied upon in connection with, any subsequent contract or agreement. It does not constitute, and may not be used for the purpose of, an offer or invitation to subscribe for or otherwise acquire shares in any of the products mentioned.
Past performance is not a guide to future returns.
The views expressed are opinions of the portfolio managers as of the date of this document and are subject to change based on market and other conditions and may differ from other portfolio managers or of the firm as a whole. These opinions are not intended to be a forecast of future events, research, a guarantee of future results or investment advice.
Some of the information provided in this document has been compiled using data from a representative account. This account has been chosen on the basis it is an existing account managed by Martin Currie, within the strategy referred to in this document. Representative accounts for each strategy have been chosen on the basis that they are the longest running account for the strategy. This data has been provided as an illustration only, the figures should not be relied upon as an indication of future performance. The data provided for this account may be different to other accounts following the same strategy. The information should not be considered as comprehensive and additional information and disclosure should be sought.
The information provided should not be considered a recommendation to purchase or sell any particular strategy/ fund/security. It should not be assumed that any of the security transactions discussed here were or will prove to be profitable.
Risk warnings - Investors should also be aware of the following risk factors which may be applicable to the strategy shown in this document.
- Investing in foreign markets introduces a risk where adverse movements in currency exchange rates could result in a decrease in the value of your investment.
- Emerging markets or less developed countries may face more political, economic or structural challenges than developed countries. Accordingly, investment in emerging markets is generally characterised by higher levels of risk than investment in fully developed markets.
- This strategy may hold a limited number of investments. If one of these investments falls in value this can have a greater impact on the strategy’s value than if it held a larger number of investments.
- Smaller companies may be riskier and their shares may be less liquid than larger companies, meaning that their share price may be more volatile
- Income strategy charges are deducted from capital. Because of this, the level of income may be higher but the growth potential of the capital value of the investment may be reduced.