

This is an excerpt from the Franklin Templeton Institute's Energy Transition paper, originally posted here.
The investment required to deliver energy transformation at a global level has a very wide range of forecasts; however, what is clear is that the capital expenditure numbers are quite staggering.
The Challenge: Triple Capacity While Reducing Emissions
According to the International Renewable Energy Agency (IRENA), 2022 investments in energy transition technologies reached a new record of US$1.3 trillion. By 2050, cumulative investments must amount to US$150 trillion, averaging US$5 trillion a year to get anywhere near the 1.5°C warming pathway for 2050, as seen in Exhibit A1. Alongside investments in renewable generation, electrification and grid expansion will have an important role in enabling efficient and flexible transition technologies.
These investments will also help completely remake the mix of energy sources, while also nearly tripling the generating capacity, seen in Exhibit B. Both of those are critical for supporting a growing global population. And in some emerging-market countries, such as India or the Philippines, the electrification revolution also involves connecting entire communities to electricity for the first time.
Our team is very excited by the growth prospects of listed utilities. When we combine our urban population growth thematic investment screens with the electrification opportunity, we believe that once “boring” or stable listed utilities may have some additional spark in the years ahead. We explore this through two case studies later in the piece, one from a developed market and one from an emerging market.
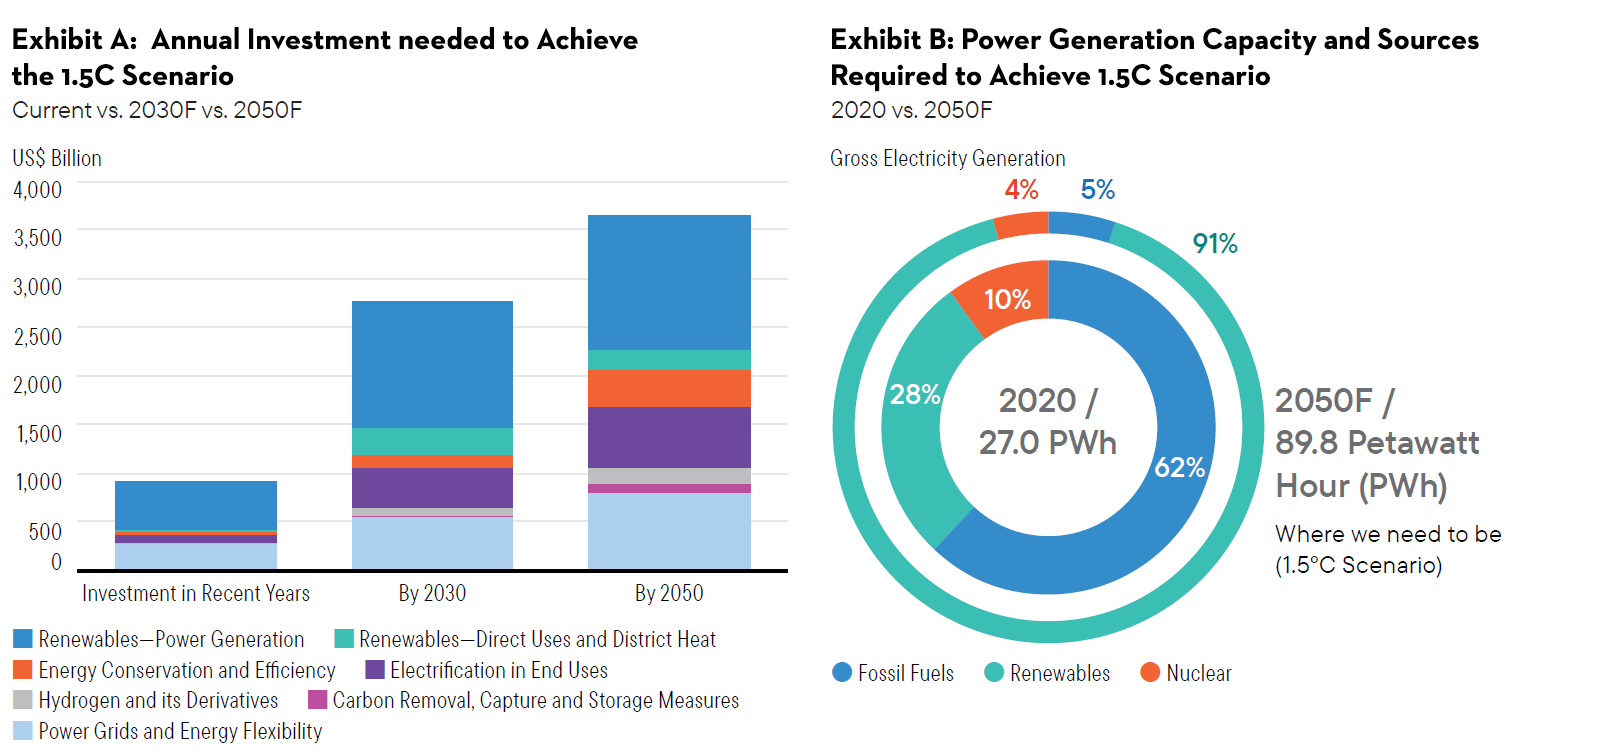
Source (for both charts above): IRENA. 2023. World Energy Transitions Outlook 2023: 1.5°C Pathway; Preview. IRENA : Abu Dhabi. Note: A petawatt is equivalent to a quadrillion watts. F = forecast. There is no assurance any forecast, projection or estimate will be realized.
-
Alongside investments in renewable generation, electrification and grid expansion will have an important role in enabling efficient and flexible transition technologies.
The current electricity grid environment
Electricity transmission networks traditionally connected large power generators, such as coal, gas or nuclear, generally located a long distance from where people live and work, to the lower-voltage distribution networks in our cities and towns.
In many countries, the system evolved to connect networks between countries or states. For example, the UK National Grid now connects to various other European counties, and Australia’s east coast now has the longest interconnected electricity system in the world. The expanding electrical grids help diversify the sources of energy, which improves reliability as well as access to and transport of the lowest- cost generation.
While the private sector traditionally owned the electricity grids in the United States, in many parts of the world, grid ownership and development were managed by the public sector. However, over the last few decades, we‘ve seen governments in many countries sell down, privatize and publicly list electricity grids—providing much needed funds for other expenditure items. Today, the private sector is a key stakeholder in distribution utilities, with around 29% of them privately owned. However, in high-income countries, there is a much larger proportion; around 40% to 45% are privately owned2. After a utility has been privatized, governments often continue to play a major role in the privately owned grids via regulation of the sector. Private or listed ownership of electricity grids is facilitating private capital investment into the ongoing capital expenditure of electricity grids, and we believe this will help facilitate the energy transition and grow the rate/asset bases of the electricity grids.
Electrifying a lower-carbon economy
As aging, coal-fired, gas-fired or nuclear generation assets are retired, they are increasingly replaced by renewables such as wind, solar, geothermal or hydro. Unlike traditional fossil fuel generation, where a large amount of capacity is in one location (i.e., the “power plant”), the new mix of renewable sources are often in many different locations, requiring a lengthening and expansion of transmission networks into new areas.
We are believers in electrification’s role as a key pillar in a lower-carbon economy. Advantages of electrification include sourcing low emissions electricity generation from renewable sources and facilitating improved efficiency through electric technologies (such as EVs and heat pumps) compared to fossil fuel-based alternatives.
Electrification demand
Some key areas where we see electrification demand:
As electrification of industry and transport ramps up, we expect to see significant growth in the total amount of electricity consumed, which will necessitate an increase in the capacity of the whole system. Expansion likely requires significant network capital expenditure as well as additional storage, smart grids and energy efficiency.
While electrification may be the long-term solution to a lower carbon economy, the massive growth in electricity demand may potentially also require some of the older generation sources, such as coal, gas or aging nuclear plants, to delay mothballing and continue running for the medium term to meet peak-demand-period requirements. We believe reliability of the electricity grid is an important part of the sector, maintaining a strong social license to operate and the political support for transition.
Developing energy storage systems
Renewable energy intermittency will also require a mix of fast-start thermal generation and/or a large increase in energy storage solutions, such as: batteries, pumped hydro or potentially newer technologies such as hydrogen. Many of these will need to be incorporated into existing grids.
At times, new generation creates bottlenecks within electricity networks; therefore, the location of energy storage will be far from universal. For example, if the bottleneck is between a remote solar or wind generation source and a major load center, then locating the storage near the generation source may make sense. However, if the bottleneck forms within an existing city due to peak load growth, then more-localized energy storage makes sense. Urban planning is also now considering and incorporating the energy transition, through better building designs and smarter cities that harness and store energy.
Hydrogen (or ammonia) is an interesting technology but comes with various challenges around production, energy losses, water use, current high costs, and difficulty with storage and transport. For many applications, battery storage appears to be a much better solution any may prevent or slow widespread global use of hydrogen. However, in some countries with high demand and limited land mass to generate renewable electricity, offshore hydrogen may well be part of the solution. For example, Australia is utilizing its large land mass to produce green hydrogen for export to Japan or Korea.
Funding of energy storage systems will come from multiple sources, and investors appear keen to deploy capital into energy transition. Traditional utilities integrating storage into management of their existing supply and demand are employing a wide mix of different methods such as traditional equity and corporate debt, as well as traditional project finance for these critical investments. We are also seeing non-traditional stakeholders such as mining companies, IT billionaires, family offices and mutual funds enter the energy storage space using a wide range of traditional structured financing methods. Many are based on long-term offtake contracts to the traditional utilities, and some are even taking on more risk via developing projects without price or revenue certainty. This is based on a view that the transition will accelerate increasing energy price volatility and hence potentially increase returns on storage investments.
Smart grids and energy efficiency
Given that existing energy systems were not originally designed with such massive change in mind, we also believe that smart grids and energy efficiency will feature prominently into the future. In particular, they will help alleviate the challenges associated with the intermittency of many forms of renewable energy and also help manage the costs of bottlenecks arising within the networks.
Smart grids basically use real time information to adjust electricity demand and flows. This ensures better energy efficiency and distributed energy resources and improves the overall electricity supply system across the power grid, ultimately improving the efficiency of flows, smoothing supply and demand and lowering costs for all participants.
Growing policy support
Strong policy support for the energy transition is occurring around the world via a mix of direct incentives or emission reduction policies, such as Australia’s Safeguard Mechanism, the European Emissions Trading System and the US’s Inflation Reduction Act (IRA).
- While clearly stimulating capital investment into the listed utility sector, these incentives will also catalyze significant investment by industry. For example, New Zealand dairy processor Fonterra is investing directly in heat pumps and biomass to exit the use of coal-fired boilers3.
- In the United States, the IRA is expected to incentivize significant investments into clean energy initiatives, including renewable energy projects and battery storage. Duke Energy describes it as “game-changer” and “a once-in-a-generation legislation that funnels nearly US$400 billion of federal funding into clean energy initiatives"4.
Developed-market case study: Australia
The Australian National Electricity Market (NEM), which is managed by the Australian Energy Market Operator (AEMO), is one of the largest interconnected electricity systems in the world. It covers around 40,000 km of transmission lines and cables, supplying around nine million customers for Australia’s east coast and southern states—approximately 80% of Australia’s electricity consumption5. AEMO was established in 2009 by the Council of Australian Governments (COAG) to manage the NEM, and is made up of members representing federal and state governments, in addition to industry, to manage generation, production, and distribution of energy, as well as the wholesale and retail energy markets.
The NEM is currently undergoing significant change to accommodate and respond to changes in emissions, integrate new and emerging technologies in generation and storage and meet changes in consumer energy needs and preferences.
AEMO has published an Integrated System Plan (ISP), which is basically a whole system plan for supplying affordable and reliable electricity to homes and businesses in the eastern and southeastern states, while supporting Australia’s net-zero ambitions6.
Exhibit C highlights the forecast changes in NEM capacity to 2050 under the step change scenario, which is the scenario that most closely resembles our team’s views around significant growth in new energy sources. Martin Currie Australia also believes there will be a closure of aging thermal generation, particularly on the coal side but perhaps with slower shutdown schedules given the massive task of building and connecting all the renewable energy.
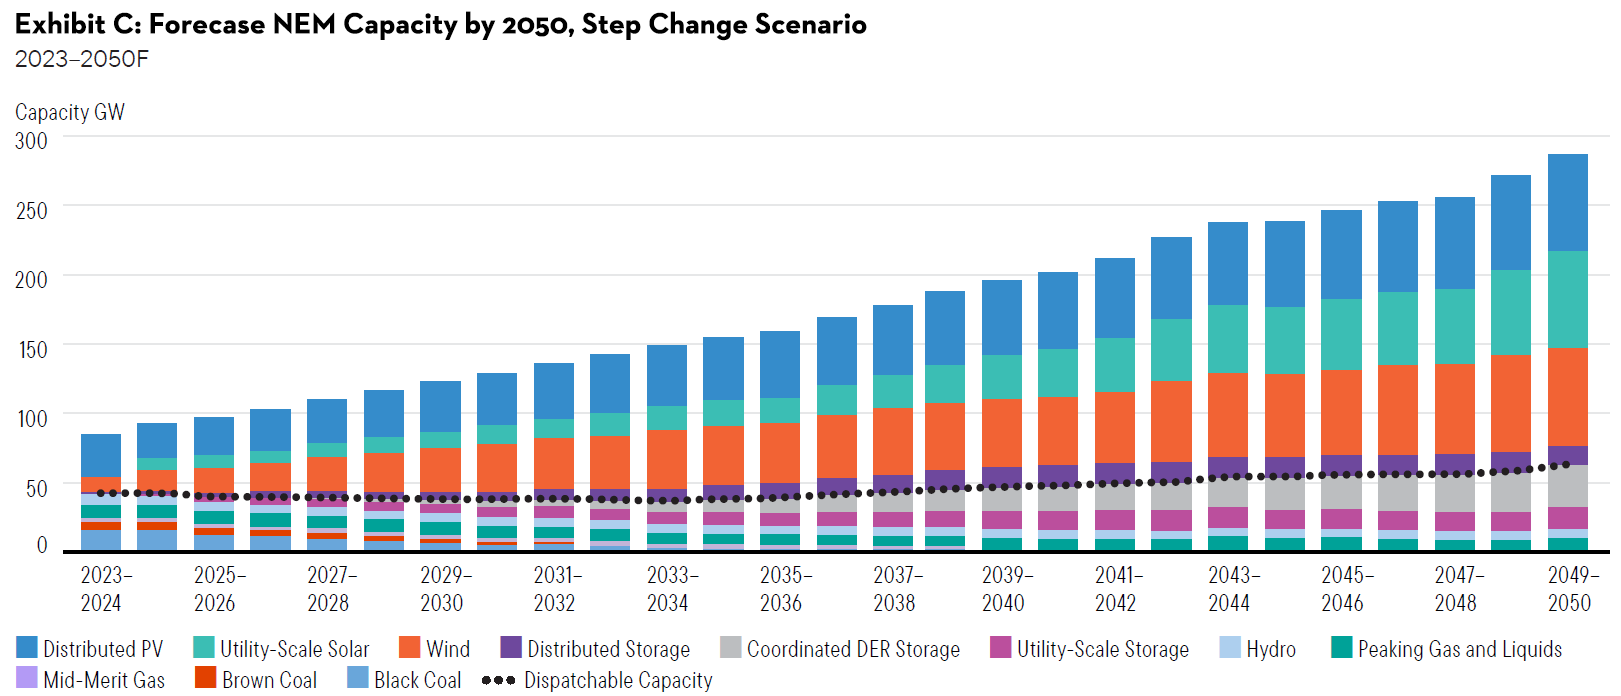
Source: Australian Energy Market Operator Limited (AEMO). 2022. 2022 Integrated System Plan. Sydney: AMEO. F=forecast. There is no assurance any forecast, projection or estimate will be realized.
Australia’s population continues to increase, as seen in Exhibit D, due to its immigration program and its lifting of COVID-19 travel restrictions. At Martin Currie, we expect that this population growth will also drive strong electricity demand growth. When combined with a transformation of the electricity network, we expect to see a significant growth in the electricity network, and opportunities for listed utilities to benefit financially from this growth.
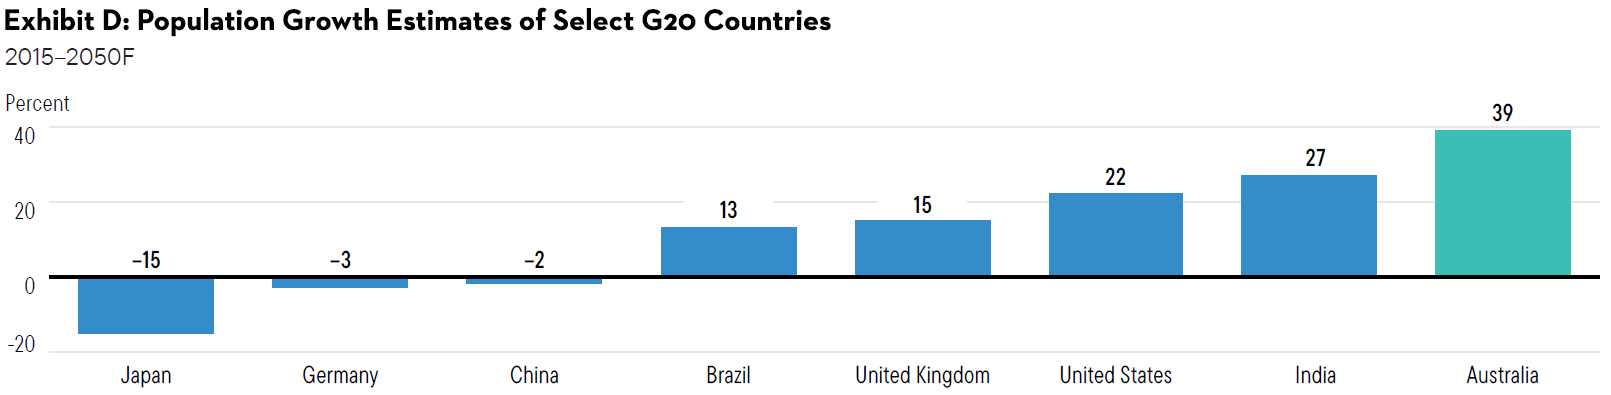
Sources: UN Population Division; United Nations, Department of Economic and Social Affairs, Population Division (2018). World Urbanization Prospects: The 2018 Revision. New York: United Nations. F=forecast. There is no assurance that any estimate, forecast or projection will be realized.
Emerging-market case study: India
India is the world’s third-largest electricity consumer with installed power capacity of over 400 gigawatts (GW) in March 2022, as seen in Exhibit E7. India’s strong urban population growth, combined with a rapidly growing middle class and electrification of energy use, is expected to result in installed capacity of almost 600 GW by March 20288 and to greater than 800 GW by March 2030 to meet national net-zero targets9. This is a whopping 9.5% per year growth rate.
We expect the Indian electricity sector to undergo a massive transformation in the years ahead to deal with this demand growth, and we also expect to see significant changes in the energy mix, as shown in Exhibit F, with an acceleration in clean energy investment. This means that the electricity transmission and distribution networks will require significant expansion by the listed utilities to connect new demand to new supply and storage sources.
However, given the demand growth is so strong, we do expect to see growth in not only renewable energy but also traditional thermal energy generation. We highlight that the Central Electricity Authority (CEA) estimates that the share of renewable energy generation would increase from 18% to 44%, while that of thermal energy is expected to reduce from 78% to 52% by 203010.
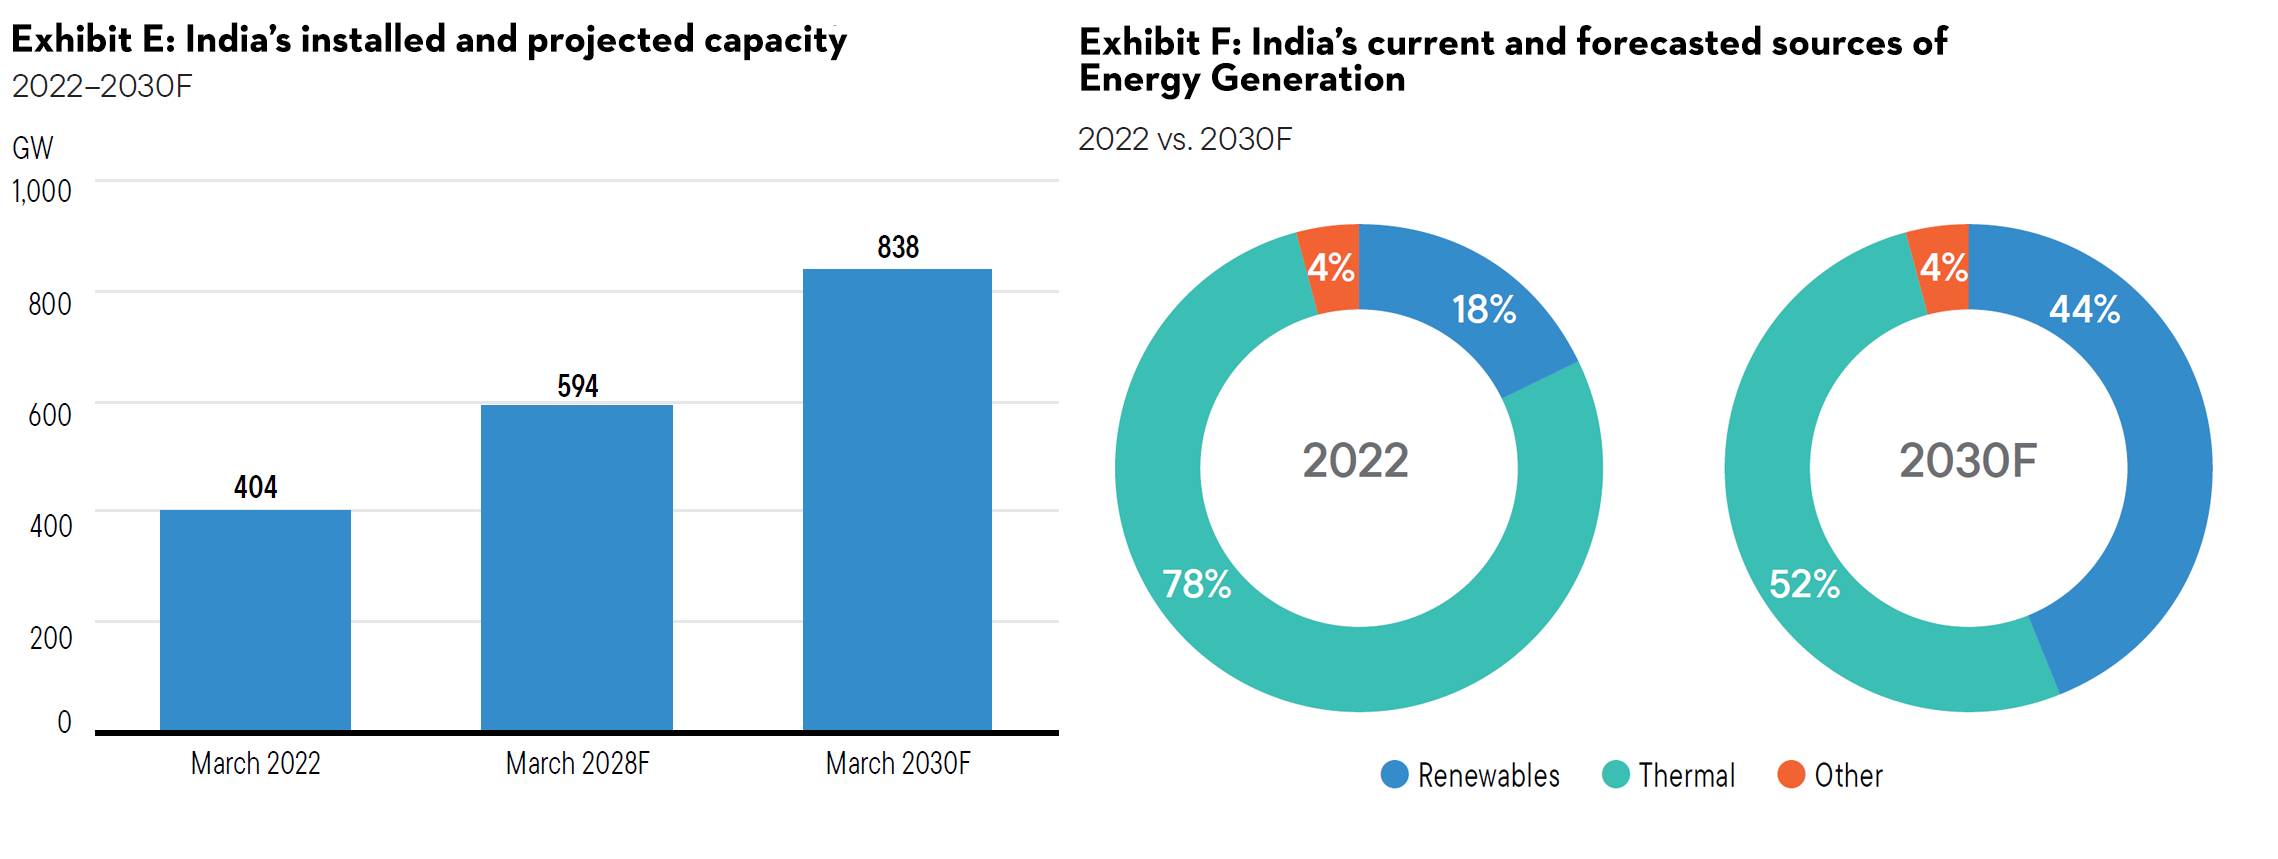
Sources (for both charts above): Powergrid India, CTUIL Rolling Plan, CEA. F=forecast. There is no assurance that any estimate, forecast or projection will be realized.
The path forward
Transition investments will increase materially in coming years to many trillions of dollars per year, with a massive increase in investments from listed real assets, unlisted infrastructure, industrial companies (including supply chains) and governments.
However, there remain considerable challenges to meet annual investments to IRENA’s suggested requirement, which amounts to over US$5 trillion per year to stay on the 1.5°C pathway11. Some of the key challenges include planning and permits, supply chain bottlenecks and labor shortages in some parts of the world.
There is also the circular reference challenge that many of the supply chains that need expanding require traditional fossil fuels during the manufacture/processing and transport, hence in some regions—particularly some emerging market economies—the energy transition may result in an increase in short-term emissions for the global transition to accelerate and bring down longer-term emissions.
At Martin Currie, we’re strong believers and supporters of electrification. However, given the size of the task ahead, a lot more needs to be done and the process may well take many decades. Despite the ongoing debate around pathways, time frames and annual spend amounts, what is very clear to us is that the once “boring” or stable listed utilities may have some additional spark in the years ahead.
-
Click here to find out more about the Martin Currie Australia Real Assets platform.
-
This piece was originally published as a chapter in a Franklin Templeton Institute white paper. Read the full Energy transition: Accelerating investment opportunities paper here.
Click to display all sources >>
1 “Investment Needs of USD 35 trillion by 2030 for Successful Energy Transition.” International Renewable Energy Agency. March 28, 2023.
2 Alkhuzam, A., Arlet, J., and Lopez Rocha, S. “Private versus public electricity distribution utilities: Are outcomes different for end-users?” World Bank Blog. May 3, 2018.
3 “Fonterra furthers decarbonisation strategy by switching to wood at Waikato.” Reuters. April 20, 2023.
4 “What Is the Inflation Reduction Act: A Commercial Business’s Overview of Energy Storage and Solar Tax Credits.” Duke Energy Sustainable Solutions. March 22, 2023.
5 Department of Climate Change, Energy, the Environment and Water. 2023.
National Electricity Market. Canberra : Commonwealth of Australia.
6 2022 Integrated System Plan. Australian Energy Market Operator. June 2022.
7 Central Transmission Utility of India Limited. Inter-State Transmission Systems (ISTS) ROLLING PLAN 2027–28 (INTERIM REPORT). September 2022.
8 Ibid.
9 Central Electricity Authority. Report on optimal generation capacity mix for 2029–30. January 2020.
10 India Brand Equity Foundation (IBEF). New Delhi : IBEF. Power Industry Report. May 2023.
11 Ibid.
Important information
This information is issued and approved by Martin Currie Investment Management Limited (‘MCIM’), authorised and regulated by the Financial Conduct Authority. It does not constitute investment advice. Market and currency movements may cause the capital value of shares, and the income from them, to fall as well as rise and you may get back less than you invested.
The information contained in this document has been compiled with considerable care to ensure its accuracy. However, no representation or warranty, express or implied, is made to its accuracy or completeness. Martin Currie has procured any research or analysis contained in this document for its own use. It is provided to you only incidentally and any opinions expressed are subject to change without notice.
The document does not form the basis of, nor should it be relied upon in connection with, any subsequent contract or agreement. It does not constitute, and may not be used for the purpose of, an offer or invitation to subscribe for or otherwise acquire shares in any of the products mentioned.
Past performance is not a guide to future returns.
The views expressed are opinions of the portfolio managers as of the date of this document and are subject to change based on market and other conditions and may differ from other portfolio managers or of the firm as a whole. These opinions are not intended to be a forecast of future events, research, a guarantee of future results or investment advice.
The analysis of Environmental, Social and Governance (ESG) factors forms an important part of the investment process and helps inform investment decisions. The strategy/ies do not necessarily target particular sustainability outcomes.
The information provided should not be considered a recommendation to purchase or sell any particular strategy/ fund/security. It should not be assumed that any of the security transactions discussed here were or will prove to be profitable. It is not known whether the stocks mentioned will feature in any future portfolio managed by Martin Currie. Any stock examples will represent a small part of a portfolio and are used purely to demonstrate our investment style.
Risk warnings - Investors should also be aware of the following risk factors which may be applicable to the strategy shown in this document.
- Investing in foreign markets introduces a risk where adverse movements in currency exchange rates could result in a decrease in the value of your investment.
- Emerging markets or less developed countries may face more political, economic or structural challenges than developed countries. Accordingly, investment in emerging markets is generally characterised by higher levels of risk than investment in fully developed markets.
- This strategy may hold a limited number of investments. If one of these investments falls in value this can have a greater impact on the strategy’s value than if it held a larger number of investments.
- Smaller companies may be riskier and their shares may be less liquid than larger companies, meaning that their share price may be more volatile.
- Income strategy charges are deducted from capital. Because of this, the level of income may be higher but the growth potential of the capital value of the investment may be reduced.
For institutional investors in Canada:
The content of this website is suitable for Permitted Clients for the purposes of NI 31-103 only. The information on this section of the website is not intended for use by any other person, including members of the public.
For wholesale investors in Australia:
Any distribution of this material in Australia is by Martin Currie Australia (‘MCA’). Martin Currie Australia is a division of Franklin Templeton Australia Limited (ABN 76 004 835 849). Franklin Templeton Australia Limited is part of Franklin Resources, Inc., and holds an Australian Financial Services Licence (AFSL No. 240827) issued pursuant to the Corporations Act 2001.
For professional investors:
In the People’s Republic of China:
This document does not constitute a public offer of the strategy, whether by sale or subscription, in the People’s Republic of China (the “PRC”). These strategies are not being offered or sold directly or indirectly in the PRC to or for the benefit of, legal or natural persons of the PRC.
Further, no legal or natural persons of the PRC may directly or indirectly purchase any of the strategy or any beneficial interest therein without obtaining all prior PRC’s governmental approvals that are required, whether statutorily or otherwise. Persons who come into possession of this document are required by the issuer and its representatives to observe these restrictions.
In Hong Kong:
The contents of this document have not been reviewed by any regulatory authority in Hong Kong. You are advised to exercise caution in relation to the offer. If you are in any doubt about any of the contents of this document, you should obtain independent professional advice.
In South Korea:
This document is for information purposes only. It is prepared and presented to provide an introduction to the business of MCIM and its related companies (collectively known as ‘Martin Currie’). This document does not constitute an offer to sell or a solicitation of any offer to invest in any security, fund or other vehicle managed or advised by Martin Currie.
None of the security(ies), fund(s) or vehicle(s) managed by or advised by Martin Currie are registered in South Korea under the Financial Investment Services and Capital Markets Act of Korea and accordingly, none of these instruments nor any interest therein may be offered, sold or delivered, or offered or sold to any person for re-offering or resale, directly or indirectly, in South Korea or to any resident of South Korea except pursuant to applicable laws and regulations of South Korea.
Martin Currie is not registered with or regulated by any regulatory authorities in South Korea.