

This article was first published on Firstlinks on October 11th 2023.
For many years we have produced an analytical, market-wide view of the Australian reporting season’s results. This framework has allowed us to logically judge the pulse of the market and assess the themes across the market that would be ‘hard to see’ when looking at each company result in isolation and apply our insights at the stock and portfolio level.
While our framework has always looked deep into the revenue, earnings and dividend environment (which has highlighted the difficult situation for company gross profit margins and earnings growth), this season we have also introduced an ‘Income Scorecard’ to look more closely at income outcomes for the stocks in the S&P/ASX 200.
Introducing the Income Scorecard
We have looked at reporting season winners and losers from a pure income perspective, rather than stock price performance, as this reflects how we think about portfolio construction for our retirement income-focused portfolios.
Retirees require a reliable income stream. By investing in stocks where stable franked dividends are a larger component of total return, we seek to provide more certainty in income generated by our income portfolios, no matter what the capital gains or losses may be for a stock.
August 2023 Income results
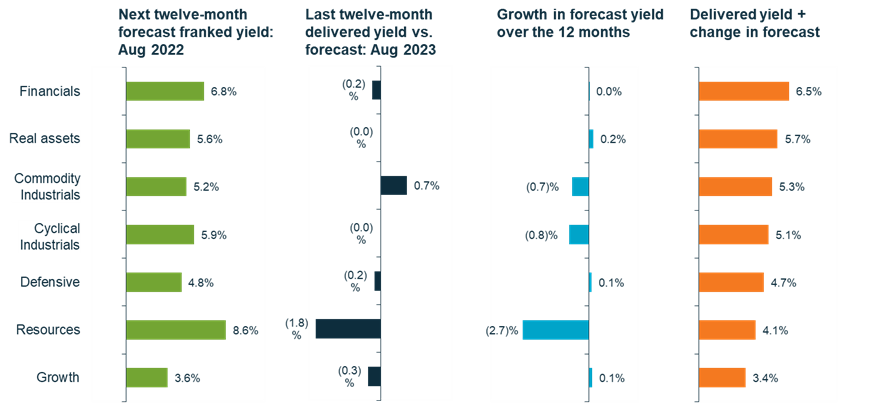
We have tracked how companies have delivered on the market’s forecast dividend expectations over the last 12 months, and how their dividend growth expectations have changed to review if are they providing any inflation protection. We then ranked them on the sum of their delivered yield and forecast yield growth and aggregated the results by super sector average.
Note that we have stripped out the impact of stock price movement on forecast yield changes over the last 12 months by assuming a static stock price based on the start of the period. We have also limited the income universe to stocks with at least a 3% franked yield, and our proprietary assessment of sufficient quality and liquidity for an income investor. This leaves us with around 115 stocks out of the S&P/ASX 200.
-
We seek to provide more certainty in income generated by our income portfolios, no matter what the capital gains or losses may be for a stock.

Financials
Financials came out on top, broadly delivering on the 6.8% franked yield expectation set in August 2022, with no reductions in forecast yield. Within the sector, Bendigo and Adelaide Bank was a standout as stable player with delivered yield and growth expectations benefiting from higher rates and Net Interest Margins (NIMs).
We would note that given much-publicised concerns over the capacity of borrowers to navigate the transition from low fixed-rate mortgages, bank sector earnings growth risks are skewed to the downside. Saying this, our proprietary estimates of the resilience of dividends for the big four banks does remain attractive. We are comfortable with retaining bank exposures for their income generating ability, however, our focus on downside income risk means that this is at a significant underweight relative to a yield-weighted view of the index.

Real Assets
In Real Assets, we also saw strong delivery against August 2022 expectations. We saw the strongest income winners in the electricity generators Origin Energy and AGL Energy, with higher dividend growth expected from higher electricity prices.
Within REITs, being discriminatory was important, and Scentre Group was a standout, delivering CPI+ rental increases. This varies with many other REITs who have fixed rate increases despite rising costs. Debt tenure was also important as those with shorter debt books are now paying higher interest costs. Higher interest rates (and cap rates) are leading to pressure on leverage and an inability or unwillingness to invest in development growth. It is evident that many companies have not hedged their interest rate positions adequately.
While Aurizon was a poor performer due to the impact of weather conditions on dividends vs. expectations, its regulated rail network earnings and group dividends are well-placed to benefit from this year’s regulatory reset and inflation-linked contract prices.

Commodity Industrials
Within Commodity Industrials companies, petrol retailers such as Ampol and Viva Energy Group helped the sector to deliver higher dividends than expected 12 months ago through improved margins in refining, but growth is expected to be muted going forward.

Cyclical Industrials
Within the more Cyclical Industrials, discretionary retailers such as Super Retail Group and JB Hi-Fi stood out due to super profits translating into strong dividends and strong balance sheet positions. The next 12 months will be harder, but as dividends have been conservative, there is still a good buffer.
For cyclical companies, the boom period for gross profit margins really is over. Selling prices are no longer rising to offset falling volumes as consumers (in particular younger people and families) hold back as interest rates continue to normalise. At the same time, the cost of doing business is rising, and rising faster into FY24 than FY23. Companies are starting to suffer from wage rises, accelerating rent rises, and other things like higher insurance, electricity costs and tech spend.

Defensives
Income for the Defensives as a whole did not do as well as expected in a downturn, as revenue has not grown with inflation. However, stocks such as Lottery Corporation delivered both a good dividend and growth expectations in a tough environment as they raised prices and continue to move ticket sales online away from newsagents. Telstra also had good inflation protection in its revenues through its mobile plan price rises.

Resources
Resources companies, while seen as strong dividend payers on an absolute basis 12 months ago, have failed to deliver versus expectations.
They have suffered, stemming from the weak outlook for China property policy and the impact of lower forward commodity price expectations and higher costs for capex programs for mine replacement and net zero initiatives feeding into weaker earnings expectations. Forward dividend growth has been severely reduced, with fundamentals for iron ore looking the worst among the commodities. From an income perspective, BHP is in our view better placed to deliver than others in the sector.

Growth
The Growth bucket is small for income stocks given poor dividend yields, but within the qualifying names, Carsales.com did better than most.
What this all means
At the aggregate market-weighted level, we are expecting to see another year of poor dividend growth, dominated by the ongoing decline in expected profit margins for the Resources names. In our view, pockets of potential growth reside in the Real Assets, Industrials, and the Insurers (but not the Banks) within Financials.
Positioning our income portfolios
We continually adjust our portfolios based on the information we are getting from various sources, which include reporting season results, company meetings and engagements. These all provide a valuable opportunity to gain deeper insights and hone our investment thesis for each company.
For some time, our portfolios have been positioned for a possible earnings or GDP recession. We have lowered the beta of our portfolios and focused on companies that can support fundamentally higher franked dividends in the higher rate environment and not be exposed to valuation risk. Our retiree-focused Martin Currie Equity Income strategy, is designed to limit the portfolio to no more than 6% in any one stock and 22% in any one economic sector. This leads to a structural underweight towards large caps.
Our highly diversified portfolio includes high-quality names such as Medibank Private, ANZ Banking Group, Telstra Group, Suncorp Group, and Aurizon Holdings.
As of 30 September 2023, on a forward-looking basis, the strategy is expected to provide a franked dividend yield of 6.5% over the next 12 months, which compares very attractively to the 5.2% expected franked dividend yield for the S&P/ASX 200.
Graph source
Past performance is not a guide to future returns.
The information provided should not be considered a recommendation to purchase or sell any particular security. It should not be assumed that any of the security transactions discussed here were, or will prove to be, profitable.
Source: Martin Currie Australia, FactSet; as of 31 August 2023. Chart data is for our income screened universe within the S&P/ASX 200 Index. Holdings and yield information is for a representative Equity Income portfolio.
NTM: next twelve months; LTM: Last twelve months
Data is calculated using the weighted average of broker consensus forecasts of each portfolio holding – because of this, the returns quoted are estimated figures and are therefore not guaranteed and may differ materially from the figures mentioned. The figures may also be affected by inaccurate assumptions or by known or unknown risks and uncertainties. For broker consensus data, the number of brokers included for each individual stock will depending on active coverage of that stock by a broker at any point in time. A median of brokers is typically utilised. All estimates avoid stale forecasts which are removed after a certain number of days.
Franked data assumes zero percent tax rate and full franking benefits realised in tax return.
Important information
This information is issued and approved by Martin Currie Investment Management Limited (‘MCIM’), authorised and regulated by the Financial Conduct Authority. It does not constitute investment advice. Market and currency movements may cause the capital value of shares, and the income from them, to fall as well as rise and you may get back less than you invested.
The information contained in this document has been compiled with considerable care to ensure its accuracy. However, no representation or warranty, express or implied, is made to its accuracy or completeness. Martin Currie has procured any research or analysis contained in this document for its own use. It is provided to you only incidentally and any opinions expressed are subject to change without notice.
The document does not form the basis of, nor should it be relied upon in connection with, any subsequent contract or agreement. It does not constitute, and may not be used for the purpose of, an offer or invitation to subscribe for or otherwise acquire shares in any of the products mentioned.
Past performance is not a guide to future returns.
The views expressed are opinions of the portfolio managers as of the date of this document and are subject to change based on market and other conditions and may differ from other portfolio managers or of the firm as a whole. These opinions are not intended to be a forecast of future events, research, a guarantee of future results or investment advice.
Some of the information provided in this document has been compiled using data from a representative account. This account has been chosen on the basis it is an existing account managed by Martin Currie, within the strategy referred to in this document. Representative accounts for each strategy have been chosen on the basis that they are the longest running account for the strategy. This data has been provided as an illustration only, the figures should not be relied upon as an indication of future performance. The data provided for this account may be different to other accounts following the same strategy. The information should not be considered as comprehensive and additional information and disclosure should be sought.
The information provided should not be considered a recommendation to purchase or sell any particular strategy/ fund/security. It should not be assumed that any of the security transactions discussed here were or will prove to be profitable. It is not known whether the stocks mentioned will feature in any future portfolio managed by Martin Currie. Any stock examples will represent a small part of a portfolio and are used purely to demonstrate our investment style.
Risk warnings - Investors should also be aware of the following risk factors which may be applicable to the strategy shown in this document.
- Investing in foreign markets introduces a risk where adverse movements in currency exchange rates could result in a decrease in the value of your investment.
- This strategy may hold a limited number of investments. If one of these investments falls in value this can have a greater impact on the strategy’s value than if it held a larger number of investments.
- Smaller companies may be riskier and their shares may be less liquid than larger companies, meaning that their share price may be more volatile.
- Income strategy charges are deducted from capital. Because of this, the level of income may be higher but the growth potential of the capital value of the investment may be reduced.